A Demand Curve Enables A Firm To Examine Prices Blank______.
Onlines
Mar 13, 2025 · 7 min read
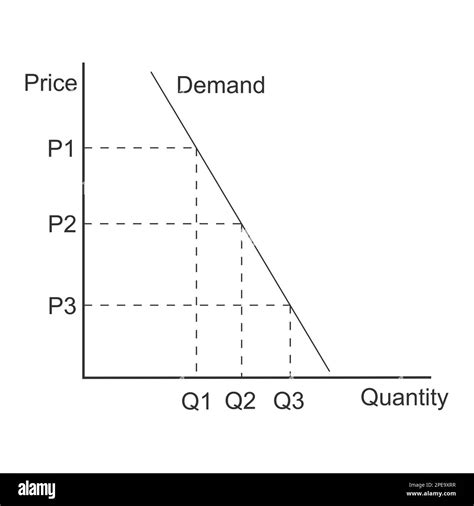
Table of Contents
A Demand Curve Enables a Firm to Examine Prices: Revenue, Elasticity, and Optimal Pricing Strategies
A demand curve is a fundamental concept in microeconomics that visually represents the relationship between the price of a good or service and the quantity demanded by consumers. It's a crucial tool for firms, enabling them to examine prices in relation to various critical factors, ultimately informing pricing strategies and maximizing profitability. This article will delve deep into how a demand curve allows a firm to examine prices, specifically focusing on its implications for revenue, price elasticity of demand, and the development of optimal pricing strategies.
Understanding the Demand Curve
Before examining what a demand curve reveals about prices, let's establish a firm understanding of what it is. A demand curve is typically graphed with price on the vertical axis (y-axis) and quantity demanded on the horizontal axis (x-axis). It slopes downwards, reflecting the law of demand: as the price of a good decreases, the quantity demanded increases (ceteris paribus – all other things being equal). This inverse relationship holds true for most goods and services.
However, it's crucial to remember that the demand curve is not static. It can shift due to various factors affecting consumer behavior, including:
- Changes in consumer income: An increase in disposable income often leads to an outward shift of the demand curve (increased demand at all price points), while a decrease causes an inward shift.
- Changes in consumer tastes and preferences: Trends, advertising, and social influence significantly impact demand. A desirable new product might shift the demand curve outwards.
- Changes in prices of related goods: Substitute goods (products that can be used in place of each other) and complementary goods (products often consumed together) affect demand. A price increase in a substitute good might shift the demand curve for the original good outwards, whereas a price increase in a complementary good might shift it inwards.
- Changes in consumer expectations: Anticipation of future price changes or product availability alters current demand.
- Changes in the number of buyers: A larger market with more potential customers shifts the demand curve outwards.
Examining Prices and Total Revenue
The demand curve directly allows firms to analyze the relationship between price and total revenue. Total revenue (TR) is simply the price (P) multiplied by the quantity sold (Q): TR = P * Q. By examining the demand curve, a firm can predict the total revenue generated at different price points.
Understanding Revenue at Different Price Points:
- High Prices, Low Quantity: At high prices, the quantity demanded is low. While the price per unit is high, the low sales volume may lead to relatively low total revenue.
- Optimal Price Point: There exists an optimal price point that maximizes total revenue. This point typically lies on the elastic portion of the demand curve (discussed in detail below). Lowering the price from this point will reduce total revenue.
- Low Prices, High Quantity: At very low prices, although the quantity demanded is high, the low price per unit might result in lower total revenue than at the optimal price point.
The shape of the demand curve directly dictates the nature of the relationship between price and total revenue. A steeper demand curve suggests that small price changes have a less pronounced effect on quantity demanded, resulting in a more stable revenue stream. Conversely, a flatter demand curve indicates that small price changes significantly impact quantity demanded.
Price Elasticity of Demand: A Critical Insight
The demand curve enables a firm to assess price elasticity of demand, a crucial concept for pricing decisions. Price elasticity of demand measures the responsiveness of quantity demanded to changes in price. It is calculated as the percentage change in quantity demanded divided by the percentage change in price.
Types of Price Elasticity:
- Elastic Demand (E > 1): A percentage change in price leads to a larger percentage change in quantity demanded. In this case, a price decrease increases total revenue, while a price increase decreases total revenue. This is typically observed for goods with many substitutes.
- Inelastic Demand (E < 1): A percentage change in price leads to a smaller percentage change in quantity demanded. Here, a price increase increases total revenue, and a price decrease decreases total revenue. Essential goods and services, often lacking close substitutes, tend to exhibit inelastic demand.
- Unitary Elastic Demand (E = 1): A percentage change in price leads to an equal percentage change in quantity demanded. Total revenue remains unchanged despite price fluctuations.
The position on the demand curve significantly influences elasticity. The upper portion of the demand curve is often more inelastic, while the lower portion is typically more elastic. Understanding the elasticity allows firms to anticipate the revenue implications of price changes and make informed pricing decisions.
Using the Demand Curve to Determine Optimal Pricing Strategies
The demand curve is not just a visual representation; it's a powerful tool for developing optimal pricing strategies. By combining the analysis of total revenue and price elasticity, firms can identify the price point that maximizes profits.
Methods for Determining Optimal Pricing:
- Marginal Revenue Analysis: Marginal revenue (MR) represents the additional revenue generated from selling one more unit. The optimal price is where marginal revenue equals marginal cost (MC). This point signifies the point at which the additional revenue from selling one more unit is equal to the cost of producing it, maximizing profit. The demand curve and its associated marginal revenue curve are crucial for this analysis.
- Markup Pricing: This method involves setting a price that is a certain percentage higher than the cost of production. The markup percentage is determined by considering factors such as competition, desired profit margins, and the elasticity of demand. The demand curve helps in assessing the appropriate markup, ensuring it is in line with the market's responsiveness to price changes.
- Price Discrimination: If a firm can segment its market into groups with different price elasticities, it can charge different prices to each group. This strategy exploits differences in demand responsiveness to extract higher profits. The demand curve for each segment is crucial in designing this pricing strategy.
- Value-Based Pricing: This method focuses on the perceived value of the product or service to the customer. The firm uses market research and understanding of customer preferences (revealed through the demand curve) to set a price that reflects this perceived value.
Analyzing Demand Curve Shifts and their Impact on Pricing
As mentioned earlier, the demand curve is not static. External factors can cause it to shift, necessitating adjustments to pricing strategies.
Impact of Shifts on Pricing:
- Outward Shift (Increase in Demand): An outward shift, representing increased demand, generally allows for price increases without drastically reducing quantity sold. Firms can leverage this increased demand to improve profit margins.
- Inward Shift (Decrease in Demand): An inward shift, indicating decreased demand, may necessitate price reductions to maintain sales volume and avoid losses. Firms might need to re-evaluate their marketing strategies and product offerings to stimulate demand.
Limitations of the Demand Curve in Real-World Applications
While the demand curve is a valuable analytical tool, it has limitations:
- Ceteris Paribus Assumption: The demand curve assumes all other factors remain constant. In reality, this is rarely the case. Numerous variables simultaneously affect demand.
- Difficulty in Accurate Forecasting: Accurately predicting the demand curve requires robust market research and data analysis. It's challenging to perfectly anticipate consumer behavior.
- Dynamic Market Conditions: Markets are constantly changing, making it difficult to maintain an up-to-date and accurate demand curve.
Conclusion: The Demand Curve – A Powerful Tool for Pricing Decisions
The demand curve is an indispensable tool for firms to examine prices, providing insights into revenue generation, price elasticity, and optimal pricing strategies. By understanding the relationship between price and quantity demanded, firms can make informed pricing decisions that maximize profits and navigate dynamic market conditions. However, its application requires careful consideration of its limitations and the need for constant monitoring of market changes and consumer behavior. The effective use of the demand curve, coupled with robust market research and sound business judgment, is paramount for achieving long-term success in any competitive marketplace.
Latest Posts
Latest Posts
-
Q5 1 Which Of The Following Is False
Mar 13, 2025
-
Ap Lang Unit 8 Progress Check
Mar 13, 2025
-
Based On The Passage The Haida Had Values That
Mar 13, 2025
-
To Understand An Assertion Is To It
Mar 13, 2025
-
Drag The Tiles To The Correct Boxes
Mar 13, 2025
Related Post
Thank you for visiting our website which covers about A Demand Curve Enables A Firm To Examine Prices Blank______. . We hope the information provided has been useful to you. Feel free to contact us if you have any questions or need further assistance. See you next time and don't miss to bookmark.
