Estimate The Following Limit Using Graphs Or Tables.
Onlines
Mar 23, 2025 · 6 min read
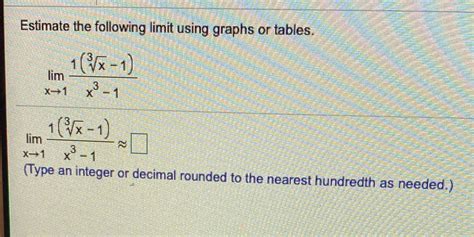
Table of Contents
Estimating Limits Using Graphs and Tables: A Comprehensive Guide
Estimating limits is a fundamental concept in calculus. It involves determining the value a function approaches as its input approaches a specific value. While analytical methods provide precise solutions, graphical and tabular methods offer valuable insights and approximations, especially when dealing with complex functions or situations where analytical solutions are difficult to obtain. This comprehensive guide will delve into the process of estimating limits using graphs and tables, equipping you with the skills to effectively analyze function behavior and approximate limit values.
Understanding Limits: A Quick Recap
Before diving into estimation techniques, let's briefly revisit the definition of a limit. We write:
lim_(x→a) f(x) = L
This statement means that as x approaches a, the function f(x) approaches L. Importantly, this doesn't necessarily mean f(a) = L; the function may not even be defined at x = a. The limit focuses solely on the behavior of the function near a.
Estimating Limits Graphically
Graphical estimation involves visually inspecting the graph of a function to determine the value it approaches as x approaches a specific point.
Steps for Graphical Estimation:
-
Sketch the Graph: Create an accurate graph of the function f(x) around the point x = a where you want to estimate the limit. Using graphing software or careful hand-plotting is crucial for accuracy.
-
Trace the Function: Follow the graph of the function as x approaches a from both the left (x → a⁻) and the right (x → a⁺).
-
Observe the y-value: Observe the y-value the function seems to be approaching as x gets arbitrarily close to a from both directions. If the function approaches the same y-value from both sides, then the limit exists and is equal to that y-value.
-
Note Discontinuities: Be aware of discontinuities (holes, jumps, vertical asymptotes) in the graph. These can significantly impact the limit's existence and value. A limit exists only if the function approaches the same value from both the left and the right.
-
Estimate the Limit: Based on your observations, provide an estimate for the limit. The accuracy of your estimate depends on the clarity of the graph and the scale used.
Example: Graphical Estimation
Let's consider the function:
f(x) = (x² - 1) / (x - 1)
We want to estimate:
lim_(x→1) f(x)
A graph of this function reveals a hole at x = 1. However, as x approaches 1 from both sides, the function appears to approach a y-value of 2. Therefore, we can graphically estimate:
lim_(x→1) (x² - 1) / (x - 1) ≈ 2
(Insert a graph here showing f(x) = (x² - 1) / (x - 1) with a clear indication of the limit as x approaches 1)
Estimating Limits Using Tables
Tabular estimation involves creating a table of function values for x values increasingly close to a. This allows us to observe the trend of f(x) as x approaches a.
Steps for Tabular Estimation:
-
Choose x-values: Select a set of x-values approaching a from both the left and the right. The values should be progressively closer to a. For example, you might choose values like: a - 0.1, a - 0.01, a - 0.001, a + 0.001, a + 0.01, a + 0.1
-
Calculate f(x): Calculate the corresponding f(x) values for each x chosen in step 1. Use a calculator or software to ensure accuracy, especially for complex functions.
-
Analyze the Trend: Examine the f(x) values in the table. Observe if the values are approaching a specific number as x gets closer to a from both sides.
-
Estimate the Limit: If the f(x) values appear to converge to a single value from both the left and the right, this value represents the estimated limit.
-
Consider Precision: The accuracy of your estimate is limited by the precision of your calculations and the closeness of the x-values to a. Using more decimal places and closer x-values generally improves the accuracy.
Example: Tabular Estimation
Let's revisit the previous example:
lim_(x→1) (x² - 1) / (x - 1)
We create a table:
| x | f(x) |
|---|---|
| 0.9 | 1.9 |
| 0.99 | 1.99 |
| 0.999 | 1.999 |
| 1.001 | 2.001 |
| 1.01 | 2.01 |
| 1.1 | 2.1 |
From the table, we observe that as x approaches 1 from both sides, f(x) approaches 2. Therefore, we can tabularly estimate:
lim_(x→1) (x² - 1) / (x - 1) ≈ 2
Handling Different Limit Scenarios
Estimating limits graphically and tabularly is effective for various scenarios, but some situations require special attention:
1. Limits at Infinity: When estimating limits as x approaches positive or negative infinity, the graphical approach becomes less practical. Tabular estimation can still be useful, but you'll need to use very large positive and negative values of x to observe the trend. Analyzing the function's behavior as x becomes extremely large (or small) will provide an estimate.
2. One-sided Limits: If the function approaches different values as x approaches a from the left and the right, the limit does not exist. However, we can still estimate the one-sided limits (left-hand limit and right-hand limit) using both graphical and tabular methods separately.
3. Oscillating Functions: Some functions oscillate wildly near a point, making it difficult to estimate the limit. In such cases, additional analysis or more sophisticated techniques may be needed. A simple graphical or tabular approach might not yield a reliable estimate.
4. Indeterminate Forms: Indeterminate forms (like 0/0, ∞/∞) often arise when estimating limits. These require algebraic manipulation or L'Hôpital's rule (a more advanced calculus technique) for accurate calculation, although graphical and tabular methods can offer initial insights into the function's behavior.
Combining Graphical and Tabular Methods
For enhanced accuracy and confidence in your limit estimations, it's often beneficial to combine both graphical and tabular methods. The graph provides a visual understanding of the function's behavior, while the table provides numerical data to support your visual observations and refine your estimate.
Conclusion
Estimating limits using graphs and tables is a valuable skill in calculus, particularly when dealing with complex functions or situations where analytical solutions are challenging. By combining visual inspection of graphs with numerical analysis of tables, you can effectively approximate the limit of a function, gaining a deeper understanding of its behavior near a specific point. Remember to always consider the limitations of these methods and utilize more advanced techniques when necessary, especially when dealing with indeterminate forms or oscillating functions. The combination of graphical and tabular approaches, however, provides a powerful and intuitive method for estimating limits, providing a strong foundation for further exploration of calculus concepts.
Latest Posts
Latest Posts
-
Answer Each Question Affirmatively Using The Correct Possessive Adjective
Mar 25, 2025
-
What Does Set And Coordinate Distribution Objectives Mean
Mar 25, 2025
-
Check All Possible Effects Of This Selective Pressure
Mar 25, 2025
-
Welcome To Yellowstone Park Is An Example Of A
Mar 25, 2025
-
Which Is Not True Of Cooking Foods In A Microwave
Mar 25, 2025
Related Post
Thank you for visiting our website which covers about Estimate The Following Limit Using Graphs Or Tables. . We hope the information provided has been useful to you. Feel free to contact us if you have any questions or need further assistance. See you next time and don't miss to bookmark.
