Match The Graph Of F With The Correct Sign Chart
Onlines
Mar 27, 2025 · 5 min read
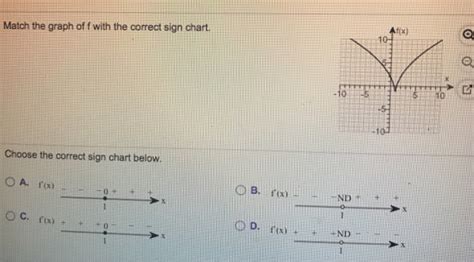
Table of Contents
Matching the Graph of a Function with its Sign Chart: A Comprehensive Guide
Understanding the relationship between the graph of a function and its sign chart is crucial in calculus and precalculus. A sign chart, also known as a sign diagram, visually represents the intervals where a function is positive (above the x-axis) or negative (below the x-axis). This information is invaluable for solving inequalities, finding critical points, and understanding the behavior of functions. This guide will delve into the intricacies of matching graphs with their corresponding sign charts, providing clear explanations and examples to solidify your understanding.
Understanding the Basics: Graphs and Sign Charts
Before diving into matching, let's refresh our understanding of graphs and sign charts.
The Graph of a Function
The graph of a function, f(x), is a visual representation of all ordered pairs (x, f(x)) that satisfy the function's definition. The graph shows the function's behavior, including its:
- Roots (or x-intercepts): The values of x where f(x) = 0. These points are where the graph intersects the x-axis.
- y-intercept: The value of f(x) when x = 0. This is the point where the graph intersects the y-axis.
- Increasing/Decreasing Intervals: Intervals where the function's value increases or decreases as x increases.
- Local Maxima and Minima: Points where the function reaches a peak (local maximum) or a valley (local minimum) within a specific interval.
- Asymptotes: Lines that the graph approaches but never touches.
The Sign Chart (Sign Diagram)
A sign chart organizes the information about the sign of a function across different intervals. It's a simple table or diagram that shows:
- Critical Points: The values of x where the function's sign might change. These typically include roots and points of discontinuity.
- Intervals: The regions between critical points.
- Sign: Whether the function is positive (+) or negative (-) in each interval.
Matching Graphs and Sign Charts: A Step-by-Step Approach
Matching a graph to its sign chart involves a systematic approach. Here's a step-by-step guide:
Step 1: Identify the Roots (x-intercepts) of the Function from the Graph
Carefully examine the graph and pinpoint all points where the curve intersects the x-axis. These are the roots of the function, where f(x) = 0. List these roots in ascending order.
Step 2: Determine the Intervals Based on the Roots
The roots divide the x-axis into intervals. These intervals are the regions where the function's sign remains constant. List these intervals using interval notation (e.g., (-∞, a), (a, b), (b, ∞)).
Step 3: Analyze the Sign of the Function in Each Interval
Observe the graph to determine whether the function's value is positive (above the x-axis) or negative (below the x-axis) within each interval identified in Step 2. Record the sign (+ or -) for each interval.
Step 4: Construct the Sign Chart
Create a sign chart that visually represents the information gathered in Steps 1-3. The chart typically includes:
- A horizontal line representing the x-axis.
- The roots marked on the line.
- The intervals indicated below the line.
- The signs (+ or -) indicated above the line, corresponding to each interval.
Step 5: Compare the Constructed Sign Chart with the Given Options
Compare the sign chart you constructed with the given options. The matching sign chart will have the same roots and the same signs in the corresponding intervals.
Examples: Matching Graphs and Sign Charts
Let's illustrate the process with a few examples.
Example 1: A Simple Quadratic Function
Consider a parabola that opens upwards and intersects the x-axis at x = -2 and x = 1.
Step 1: Roots are -2 and 1.
Step 2: Intervals are (-∞, -2), (-2, 1), and (1, ∞).
Step 3: The parabola is positive in (-∞, -2) and (1, ∞) and negative in (-2, 1).
Step 4: The sign chart would look like this:
     +     -     +
-----|-----|-----|-----
   -2     1
Example 2: A Cubic Function with Multiple Roots
Imagine a cubic function with roots at x = -1, x = 0, and x = 2. The graph shows the function is positive in (-∞, -1) and (0, 2), and negative in (-1, 0) and (2, ∞).
Step 4: The sign chart:
     +     -     +     -
-----|-----|-----|-----|-----
   -1     0     2
Example 3: A Function with a Vertical Asymptote
Let's consider a rational function with a vertical asymptote at x = 0 and a root at x = 1. The graph might show the function is negative in (-∞, 0) and positive in (0, 1) and (1, ∞).
Step 4: The sign chart would be:
     -     +     +
-----|-----|-----|-----
   0     1
Advanced Considerations
Multiple Roots: When a function has a root of even multiplicity (e.g., (x-a)^2), the sign of the function does not change at that root. The sign remains the same on both sides of the root.
Discontinuities: Functions with discontinuities (e.g., vertical asymptotes or removable discontinuities) require special attention. The sign chart must reflect these discontinuities and the behavior of the function around them.
Tips and Tricks for Success
- Sketch a rough graph: If you are given a function's equation, sketching a rough graph can help visualize its behavior and simplify the process.
- Test points: If you're unsure about the sign in an interval, select a test point within that interval and substitute it into the function. The sign of the result indicates the sign of the function in that interval.
- Practice: The key to mastering this skill is consistent practice. Work through various examples with different types of functions to build your understanding and confidence.
Conclusion
Matching the graph of a function with its sign chart is a fundamental skill in mathematics. By carefully analyzing the graph to identify roots, intervals, and signs, you can construct a sign chart that accurately reflects the function's behavior. Mastering this skill will enhance your ability to solve inequalities, understand function behavior, and tackle more advanced calculus concepts. Remember to practice diligently and utilize the step-by-step approach outlined above for a clear understanding. Through consistent effort, you will become proficient in matching graphs and sign charts, laying a solid foundation for your mathematical journey.
Latest Posts
Latest Posts
-
6 2 4 Practice Modeling Fitting Linear Models To Data
Mar 30, 2025
-
Constanza Who Owns And Operates A Daycare
Mar 30, 2025
-
Which Phrase Accurately Describes An Elliptical Galaxy
Mar 30, 2025
-
1 03 Quiz Food Selection Guides And Evaluations
Mar 30, 2025
-
Pediatric Advanced Life Support Test Answers
Mar 30, 2025
Related Post
Thank you for visiting our website which covers about Match The Graph Of F With The Correct Sign Chart . We hope the information provided has been useful to you. Feel free to contact us if you have any questions or need further assistance. See you next time and don't miss to bookmark.
