The Ge Business Screen Portfolio Model Evaluates Business On Dimetion
Onlines
Mar 11, 2025 · 7 min read
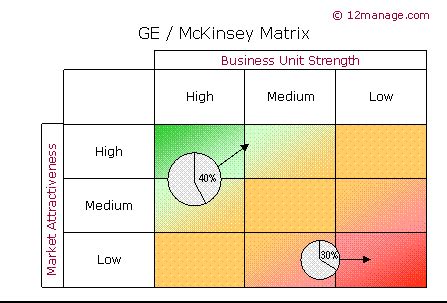
Table of Contents
GE Business Screen Portfolio Model: Evaluating Businesses on Multiple Dimensions
The General Electric (GE) Business Screen, also known as the GE McKinsey Matrix, is a powerful strategic portfolio management tool used to evaluate the attractiveness of different business units within a larger corporation. Unlike simpler portfolio models that focus solely on market share and market growth, the GE Business Screen incorporates multiple dimensions, providing a more nuanced and comprehensive assessment of a business's potential. This article delves deep into the intricacies of the GE Business Screen, explaining its dimensions, application, advantages, disadvantages, and how to use it effectively for strategic decision-making.
Understanding the Dimensions of the GE Business Screen
The GE Business Screen utilizes a nine-cell matrix, contrasting two primary dimensions: Market Attractiveness and Business Unit Competitive Strength. Each dimension is further broken down into several factors, offering a multi-faceted view of the business unit's potential.
1. Market Attractiveness
This dimension assesses the overall appeal and profitability of the market in which the business unit operates. It considers several crucial factors:
- Market Size and Growth Rate: A large and rapidly growing market presents significant opportunities. Conversely, a shrinking or stagnant market poses challenges.
- Market Profitability: High profit margins indicate a favorable market environment. Low margins suggest intense competition or other factors hindering profitability.
- Competitive Intensity: A highly competitive market with numerous players may reduce profit potential. Conversely, a less competitive market can offer higher returns.
- Technological Change: Rapid technological advancements can disrupt markets, creating both opportunities and threats. Businesses must adapt to remain competitive.
- Social and Political Factors: Government regulations, consumer preferences, and societal trends can significantly influence market attractiveness. Understanding these factors is crucial for long-term success.
- Seasonality & Cyclicality: Understanding the cyclical nature of the market and its seasonal fluctuations is key to effective resource allocation and planning.
- Entry/Exit Barriers: High barriers to entry protect established players from new competitors, while low barriers increase competition.
- Availability of Resources: Access to resources such as raw materials, skilled labor, and capital is essential for market success.
These factors are typically scored on a scale (e.g., 1 to 5, or low to high), allowing for a quantitative assessment of market attractiveness. Each factor's weight can be adjusted based on the industry and specific business circumstances.
2. Business Unit Competitive Strength
This dimension evaluates the business unit's ability to compete effectively within its market. Key factors include:
- Market Share: A higher market share generally indicates greater competitive strength and economies of scale.
- Profit Margins: High profit margins are a strong indicator of competitive advantage.
- Brand Image and Reputation: A strong brand can command premium pricing and enhance customer loyalty.
- Technological Capabilities: Advanced technology can provide a competitive edge and drive innovation.
- Production Efficiency: Cost-effective production processes are vital for profitability and competitiveness.
- Distribution Network: A well-established distribution network ensures efficient product delivery to customers.
- Financial Resources: Adequate funding is crucial for investment in growth and innovation.
- Management Quality: Strong leadership and effective management are essential for navigating market challenges and seizing opportunities.
- Product Quality and Innovation: High-quality products and continuous innovation are critical for maintaining a competitive edge.
Similar to market attractiveness, these factors are also scored, providing a quantitative measure of the business unit's competitive strength. Weighting of factors can be adjusted to reflect the specific industry context.
Plotting Businesses on the GE Business Screen
Once the market attractiveness and business unit competitive strength scores are determined, each business unit is plotted on the nine-cell matrix. The resulting placement provides valuable insights into the strategic implications for each business unit.
-
High Market Attractiveness, High Competitive Strength (Green Zone): These businesses are considered "stars" or "winners." They represent significant growth opportunities and require investment to maintain their competitive advantage and fuel further expansion. Strategies may involve aggressive growth, market penetration, and product diversification.
-
High Market Attractiveness, Medium Competitive Strength (Yellow Zone): These businesses are "question marks" or "problem children." They operate in attractive markets but lack the competitive strength to fully capitalize on the opportunities. Strategies here might focus on improving competitive strength through investment in innovation, marketing, or operational efficiency. Careful evaluation is crucial to determine whether to invest further or divest.
-
High Market Attractiveness, Low Competitive Strength (Red Zone): These businesses are typically candidates for divestment. Despite operating in an attractive market, their weak competitive position makes sustained success unlikely. Strategies might include turnaround efforts, restructuring, or complete exit from the market.
-
Medium Market Attractiveness, High Competitive Strength (Yellow Zone): These are often considered "cash cows." They generate strong cash flow from a moderately attractive market, and this cash can be used to fund growth in other business units. Strategies focus on maintaining market share and milking the business for profits.
-
Medium Market Attractiveness, Medium Competitive Strength (Yellow Zone): These businesses are in a precarious position. They require careful evaluation to determine their long-term potential. Strategies might involve targeted investments to improve competitive strength or divestment.
-
Medium Market Attractiveness, Low Competitive Strength (Red Zone): These businesses are generally weak and require significant improvement or divestment.
-
Low Market Attractiveness, High Competitive Strength (Yellow Zone): These businesses may represent niche markets with strong competitive positions. Strategies might involve maintaining the current position or selectively seeking growth opportunities.
-
Low Market Attractiveness, Medium Competitive Strength (Red Zone): These businesses present challenges and require careful consideration of their long-term viability.
-
Low Market Attractiveness, Low Competitive Strength (Red Zone): These businesses are typically candidates for divestment or liquidation. They represent a drain on resources and offer little potential for future growth.
Advantages of Using the GE Business Screen
- Comprehensive Assessment: The GE Business Screen provides a more holistic view compared to simpler portfolio models by considering multiple factors.
- Strategic Decision-Making: The matrix facilitates informed strategic decisions regarding resource allocation, investment, and divestment.
- Improved Resource Allocation: It allows for efficient allocation of resources to high-potential business units.
- Enhanced Portfolio Management: The model aids in creating a well-balanced portfolio of businesses with diverse risk and growth profiles.
- Objective Evaluation: The use of quantitative scores reduces the impact of subjective biases in strategic decision-making.
- Facilitates Communication: The visual nature of the matrix helps communicate strategic priorities and plans to stakeholders.
Disadvantages of the GE Business Screen
- Complexity: The model can be complex and time-consuming to implement, requiring significant data collection and analysis.
- Subjectivity in Scoring: While aiming for objectivity, some subjectivity may still exist in assigning weights to various factors and scoring individual factors.
- Limited Predictive Power: The GE Business Screen is a snapshot in time and does not predict future market changes or competitive dynamics.
- Data Dependency: Accurate and reliable data is crucial for the model to produce meaningful results. Lack of data or unreliable data will render the model's outputs useless.
- Oversimplification: While more comprehensive than some models, it still simplifies the complex reality of business competition and market dynamics.
Using the GE Business Screen Effectively
To effectively utilize the GE Business Screen, several key steps should be followed:
- Identify Business Units: Clearly define the individual business units that will be evaluated.
- Select Key Factors: Choose the most relevant factors for market attractiveness and competitive strength based on industry and specific circumstances.
- Assign Weights: Determine the relative importance of each factor by assigning weights. This reflects the strategic priorities of the organization.
- Score Each Factor: Assign scores to each factor based on available data and expert judgment.
- Calculate Overall Scores: Weighted average scores for market attractiveness and competitive strength are calculated for each business unit.
- Plot on the Matrix: Plot each business unit on the nine-cell matrix based on its overall scores.
- Analyze and Interpret: Analyze the resulting positions of the business units and develop appropriate strategic implications.
- Develop Action Plans: Create specific action plans for each business unit based on its position on the matrix.
- Monitor and Review: Regularly monitor the performance of each business unit and review the strategic positioning as market conditions and competitive dynamics change.
The GE Business Screen is a valuable tool for strategic portfolio management, offering a more nuanced and comprehensive assessment than simpler models. However, its effective application requires careful consideration of the chosen factors, appropriate weighting, and a thorough understanding of both the limitations and potential benefits. By following the steps outlined above and understanding the intricacies of the model, organizations can effectively leverage the GE Business Screen for informed strategic decision-making and enhanced long-term success. Remember that this is a tool to aid decision-making, not a guarantee of future success; continuous monitoring and adaptation are vital.
Latest Posts
Latest Posts
-
Puritan Laws And Character Commonlit Answers
Mar 12, 2025
-
Mrs Pierce Would Like To Enroll
Mar 12, 2025
-
Selecciona La Palabra Que No Esta Relacionada Con Cada Grupo
Mar 12, 2025
-
Why Does The President Put Vegetables In His Blender
Mar 12, 2025
-
The Journey To The West Summary Of Each Chapter
Mar 12, 2025
Related Post
Thank you for visiting our website which covers about The Ge Business Screen Portfolio Model Evaluates Business On Dimetion . We hope the information provided has been useful to you. Feel free to contact us if you have any questions or need further assistance. See you next time and don't miss to bookmark.
