The Graph Illustrates A Monopoly With Constant Marginal Cost
Onlines
Mar 25, 2025 · 7 min read
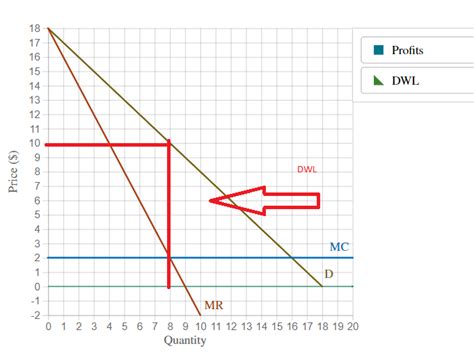
Table of Contents
The Graph Illustrates a Monopoly with Constant Marginal Cost: A Deep Dive into Market Power and Inefficiency
This article provides a comprehensive analysis of a monopoly operating under the condition of constant marginal cost. We'll explore the implications of this scenario for pricing, output, profit maximization, and overall economic efficiency. We'll also examine how this model compares to perfect competition and discuss the potential for government intervention. The analysis will be supported by graphical representations and detailed explanations.
Understanding the Model: Constant Marginal Cost and Monopoly Power
A monopoly, by definition, is a market structure characterized by a single seller controlling the supply of a particular good or service with no close substitutes. This market dominance grants the monopolist significant market power, allowing them to influence both price and quantity. Crucially, this contrasts sharply with perfect competition, where numerous firms offer identical products, and no single firm can influence market price.
Constant marginal cost refers to a scenario where the cost of producing one additional unit of output remains unchanged, regardless of the level of production. This is a simplifying assumption, but it helps to illuminate the fundamental dynamics of a monopoly. In reality, marginal costs can increase (due to diminishing returns) or decrease (due to economies of scale), but the constant marginal cost model provides a clean framework for analysis.
The graph illustrating this situation typically depicts:
-
Demand Curve (D): Shows the inverse relationship between price and quantity demanded by consumers. It slopes downwards because, generally, consumers are willing to buy more at lower prices.
-
Marginal Revenue Curve (MR): Illustrates the additional revenue generated by selling one more unit. In a monopoly, the MR curve lies below the demand curve because to sell an additional unit, the monopolist must lower the price on all units sold.
-
Marginal Cost Curve (MC): A horizontal line reflecting the constant marginal cost of production.
-
Average Cost Curve (AC): Shows the average cost per unit of output. The relationship between AC and MC depends on the fixed costs, but in this model, we'll assume that AC is above MC for all levels of output (due to the presence of positive fixed costs).
Profit Maximization: Where MC Meets MR
The monopolist, like any profit-maximizing firm, aims to produce the quantity where marginal revenue (MR) equals marginal cost (MC). This is the profit-maximizing output level, denoted as Q<sub>m</sub> on the graph. The price charged by the monopolist (P<sub>m</sub>) is determined by the point on the demand curve corresponding to Q<sub>m</sub>.
Why not produce more? Producing beyond Q<sub>m</sub> would mean that the marginal cost of producing an additional unit exceeds the marginal revenue generated by its sale, resulting in a reduction in overall profit.
Why not produce less? Producing less than Q<sub>m</sub> would mean that the monopolist is leaving potential profits on the table; they could increase their profits by producing and selling more units where MR > MC.
Graphical Representation of Profit
The monopolist's profit is represented by the area of a rectangle on the graph:
-
Height: The difference between price (P<sub>m</sub>) and average cost (AC at Q<sub>m</sub>)
-
Width: The quantity produced (Q<sub>m</sub>)
This rectangular area visually depicts the economic profit earned by the monopolist. This profit is significantly higher than what would be earned under conditions of perfect competition due to the monopolist's control over price and quantity.
Inefficiency of Monopoly: Deadweight Loss
The most significant consequence of monopoly is the deadweight loss, which represents the loss of economic efficiency. This inefficiency stems from the monopolist restricting output to maximize profits (producing at Q<sub>m</sub> instead of the socially optimal quantity).
In a perfectly competitive market, the equilibrium quantity would be where the supply curve (which represents the aggregate marginal cost curve) intersects the demand curve. This represents the allocatively efficient output level, where the marginal benefit to consumers equals the marginal cost of production. In our graph of a monopoly with constant marginal cost, this would be at a much higher quantity than Qm. The deadweight loss is the triangle formed by the demand curve, the marginal cost curve, and the quantity produced by the monopolist (Q<sub>m</sub>). This represents the net loss of consumer and producer surplus resulting from the monopolist's actions.
This area is a direct measure of the inefficiency of the monopoly: it represents goods and services that could have been produced and consumed at a price that consumers would have been willing to pay, while simultaneously being profitable to produce. The monopolist, however, restricts production to maintain higher prices and profits.
Comparing Monopoly to Perfect Competition: A Tale of Two Markets
To further highlight the inefficiency, let's compare the outcome of a monopoly to a perfectly competitive market with the same constant marginal cost.
In perfect competition:
- The price would equal the marginal cost (P<sub>c</sub> = MC).
- The quantity produced would be significantly higher (Q<sub>c</sub>).
- Economic profits would be zero in the long run due to free entry and exit.
The difference between Q<sub>c</sub> and Q<sub>m</sub> represents the lost output due to the monopolist's control over the market. This loss is further amplified by the higher price charged by the monopolist (P<sub>m</sub> > P<sub>c</sub>). This difference showcases the substantial deadweight loss in a monopoly compared to the allocative efficiency of perfect competition.
Potential Government Intervention: Regulating Monopoly Power
The inefficiency created by monopolies often leads to government intervention to promote greater market efficiency and consumer welfare. Several policy tools can be employed:
-
Antitrust Laws: These laws aim to prevent monopolies from forming or to break up existing monopolies if they are deemed to harm competition. Examples include prohibiting mergers that would create a monopoly and prosecuting firms engaging in anti-competitive practices.
-
Regulation: Governments may regulate the prices charged by monopolists, perhaps forcing them to charge a price equal to marginal cost (P=MC) or a price cap set at a level considered fair. However, this presents challenges as the monopolist might reduce output or quality if their profits are squeezed too much.
-
Nationalization: In some cases, governments may nationalize monopolist industries (taking ownership of the firms) to directly control pricing and output decisions, aiming for socially optimal outcomes. However, nationalized firms sometimes suffer from inefficiencies due to lack of market incentives.
Beyond the Simple Model: Addressing Real-World Complexity
The model discussed above relies on several simplifying assumptions. In reality, monopolies are far more complex. Factors such as:
-
Dynamic Pricing: Monopolists may adjust prices over time in response to changes in demand or market conditions.
-
Product Differentiation: Even a monopolist might offer different versions or qualities of a product, creating some degree of internal competition.
-
Technological Change: Technological advancements can impact both demand and production costs, shifting the market equilibrium.
-
International Competition: In a globalized world, domestic monopolies may face competition from international firms, which can limit their market power.
These complexities make the analysis of real-world monopolies more nuanced. However, the basic principles of profit maximization, deadweight loss, and the potential for government intervention remain crucial concepts in understanding their behaviour and societal impact.
Conclusion: The Enduring Significance of the Monopoly Model
While the model of a monopoly with constant marginal cost provides a simplified representation, it offers invaluable insights into the nature of market power, the consequences of restricted output, and the rationale behind government intervention. It highlights the inherent inefficiency of monopolies and the potential for significant deadweight losses, emphasizing the importance of policies to promote competition and consumer welfare. Understanding this basic model provides a strong foundation for analyzing more complex market structures and developing effective regulatory strategies. The enduring relevance of this model stems from its ability to clearly illustrate fundamental economic principles and their real-world implications. The implications discussed here extend far beyond the theoretical realm, influencing policy debates, business strategies, and overall economic performance.
Latest Posts
Latest Posts
-
A Nurse Is Initiating A Protective Environment
Mar 27, 2025
-
Cantos De La Virgen De Guadalupe Letra
Mar 27, 2025
-
Ap Biology Unit 2 Progress Check Mcq
Mar 27, 2025
-
Amoeba Sisters Video Recap Classification Answer Sheet
Mar 27, 2025
-
5 1 Models Of The Atom Answer Key
Mar 27, 2025
Related Post
Thank you for visiting our website which covers about The Graph Illustrates A Monopoly With Constant Marginal Cost . We hope the information provided has been useful to you. Feel free to contact us if you have any questions or need further assistance. See you next time and don't miss to bookmark.
