A Demand Curve Enables A Firm To Examine Prices
Onlines
Mar 15, 2025 · 7 min read
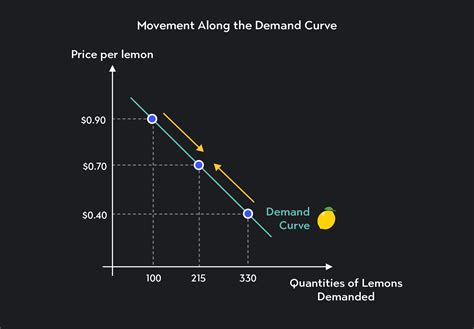
Table of Contents
A Demand Curve Enables a Firm to Examine Prices: A Deep Dive into Pricing Strategies
The demand curve, a fundamental concept in microeconomics, is a visual representation of the relationship between the price of a good or service and the quantity demanded by consumers. Understanding and effectively utilizing the demand curve is crucial for any firm aiming to optimize pricing strategies and maximize profits. This article delves deep into the intricacies of the demand curve, exploring how it enables firms to examine prices, make informed decisions, and navigate the complexities of the marketplace.
Understanding the Demand Curve: A Foundation for Pricing
The demand curve illustrates the law of demand: as the price of a good decreases, the quantity demanded increases, ceteris paribus (all other things being equal). This inverse relationship is graphically represented as a downward-sloping curve. The curve itself shows various points, each representing a specific price-quantity combination.
Factors Influencing the Demand Curve's Shape
Several factors can shift the entire demand curve, influencing the quantity demanded at any given price. These factors include:
-
Consumer Income: An increase in consumer income generally leads to an increase in demand (for normal goods), shifting the curve to the right. Conversely, a decrease in income can shift the curve to the left.
-
Prices of Related Goods: The demand for a good can be affected by the prices of substitute goods (goods that can be used in place of the good in question) and complementary goods (goods that are often consumed together). A price increase in a substitute good will increase demand for the original good, shifting its curve to the right. A price increase in a complementary good will decrease demand for the original good, shifting its curve to the left.
-
Consumer Tastes and Preferences: Changes in consumer preferences, driven by trends, advertising, or other factors, can significantly impact demand. A positive shift in preference will move the curve to the right, while a negative shift will move it to the left.
-
Consumer Expectations: Consumers' expectations about future prices or availability can influence current demand. Anticipation of a price increase may lead to increased demand now, shifting the curve to the right.
-
Number of Buyers: An increase in the number of buyers in the market will increase overall demand, shifting the curve to the right.
Understanding these factors is critical for businesses. They must constantly monitor market conditions and consumer behavior to anticipate shifts in the demand curve and adjust their pricing strategies accordingly.
Utilizing the Demand Curve for Price Examination
The demand curve provides a powerful tool for firms to analyze the price-quantity relationship and make informed pricing decisions. Here are some key ways firms use the demand curve for price examination:
1. Determining Optimal Price Points
The demand curve helps firms identify the price point that maximizes revenue or profit. This is often achieved by considering the price elasticity of demand.
-
Price Elasticity of Demand: This measures the responsiveness of quantity demanded to a change in price. If demand is elastic (a small price change leads to a large change in quantity demanded), lowering the price can increase total revenue. Conversely, if demand is inelastic (a price change has a small effect on quantity demanded), raising the price might increase total revenue.
-
Marginal Revenue: This is the additional revenue generated by selling one more unit. Firms often aim to find the price where marginal revenue equals marginal cost (the cost of producing one more unit). This point typically corresponds to profit maximization.
2. Analyzing Market Competition
The demand curve provides insights into the level of competition within a market.
-
Market Structure: The slope and shape of the demand curve can indicate the type of market structure a firm operates in. A steep demand curve might suggest a market with less competition, while a flatter curve might suggest a more competitive market.
-
Competitive Pricing Strategies: Understanding the demand curve helps firms develop effective competitive pricing strategies. Firms might use strategies such as price leadership, price skimming, or penetration pricing, all of which are informed by their understanding of the demand curve for their product or service.
3. Forecasting Demand and Revenue
The demand curve enables firms to forecast demand and revenue under different pricing scenarios.
-
Demand Forecasting: By analyzing historical data and considering the influencing factors discussed earlier, firms can project future demand at various price points. This forecasting capability allows for more accurate inventory management and resource allocation.
-
Revenue Projections: Based on the demand forecast, firms can project their revenue streams under different price scenarios, facilitating better financial planning and decision-making.
4. Evaluating Pricing Strategies Effectiveness
Firms can use the demand curve to evaluate the effectiveness of their pricing strategies.
-
Monitoring Sales Data: By tracking sales volume at various price points, firms can compare actual sales to the predicted sales from their demand curve analysis. This helps to validate the accuracy of their demand model and identify areas for improvement.
-
A/B Testing: Firms might use A/B testing to compare the effectiveness of different pricing strategies. This involves offering the same product or service at different prices to different customer segments and analyzing the resulting sales data.
Beyond the Simple Demand Curve: Advanced Considerations
While the basic downward-sloping demand curve provides a foundational understanding, real-world scenarios often require more sophisticated analysis.
1. Incorporating Price Elasticity Dynamics
Demand elasticity is not static; it can change depending on factors like the time horizon, availability of substitutes, and consumer income.
-
Short-run vs. Long-run Elasticity: Demand is often more inelastic in the short run because consumers may have limited options for substitutes. Over the long run, however, demand can become more elastic as consumers find alternatives or adapt their consumption patterns.
-
Segmenting the Market: Demand elasticity can vary across different customer segments. Firms might apply different pricing strategies to different segments based on their price sensitivity.
2. Accounting for Non-Price Factors
The ceteris paribus assumption simplifies the analysis but ignores the impact of non-price factors. In reality, other factors, such as advertising, product quality, brand loyalty, and customer service, can significantly impact demand.
3. Utilizing Advanced Econometric Modeling
For more complex situations, firms might employ advanced econometric modeling techniques to estimate demand curves. These models can incorporate multiple variables and offer more nuanced insights.
-
Regression Analysis: Regression analysis uses statistical methods to estimate the relationship between price and quantity demanded, considering other relevant variables.
-
Time Series Analysis: This technique analyses historical sales data to identify trends and patterns in demand.
Case Studies: Real-World Applications
Let's consider a few examples to illustrate the practical application of demand curve analysis:
Case Study 1: A Pharmaceutical Company
A pharmaceutical company developing a new drug needs to determine the optimal pricing strategy. Through market research and clinical trials, they estimate their demand curve. They find that demand is relatively inelastic due to the lack of substitutes for their groundbreaking medication. This allows them to set a higher price, maximizing their profit margins.
Case Study 2: A Fast-Food Restaurant
A fast-food restaurant introduces a new burger. They use A/B testing in different locations, varying the price of the new burger. By analyzing sales data, they can estimate the demand curve and determine the price point that optimizes both sales volume and profitability.
Case Study 3: An Airline
An airline is planning a new route. Using historical data on travel demand and competitor pricing, they develop a demand curve. The curve helps them determine the optimal pricing strategy considering the seasonality of the route and potential competition.
Conclusion: The Demand Curve - An Indispensable Pricing Tool
The demand curve is not just a theoretical concept; it's a vital tool for businesses of all sizes. By understanding the principles of the demand curve and employing appropriate analytical techniques, firms can effectively examine prices, make informed decisions, and enhance their profitability. While the basic model provides a solid foundation, incorporating advanced econometric techniques and considering the dynamics of price elasticity and non-price factors allows businesses to refine their pricing strategies for optimal results. Mastering the demand curve is, therefore, essential for navigating the complexities of the market and achieving sustainable success.
Latest Posts
Latest Posts
-
Court Systems And Structures Crossword Answer Key
Mar 15, 2025
-
Escape The Startup Game Answer Key
Mar 15, 2025
-
Body Cavities And Membranes Concept Map
Mar 15, 2025
-
Hardware Lab Simulation 6 2 Laptop Wireless Card Replacement
Mar 15, 2025
-
The Cask Of Amontillado Character Description
Mar 15, 2025
Related Post
Thank you for visiting our website which covers about A Demand Curve Enables A Firm To Examine Prices . We hope the information provided has been useful to you. Feel free to contact us if you have any questions or need further assistance. See you next time and don't miss to bookmark.
