Ap Biology Lab Osmosis And Water Potential Answer Key
Onlines
Mar 30, 2025 · 7 min read
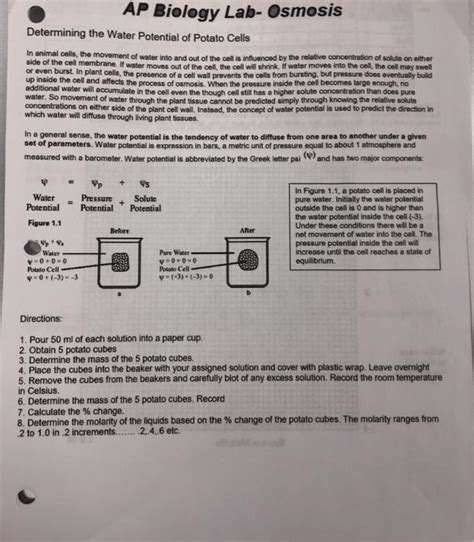
Table of Contents
AP Biology Lab: Osmosis and Water Potential – A Comprehensive Guide
The AP Biology osmosis and water potential lab is a cornerstone of the curriculum, providing hands-on experience with fundamental concepts in plant physiology. This lab delves into the intricate relationship between water potential, osmosis, and the turgor pressure within plant cells. Understanding these principles is crucial for comprehending plant growth, adaptation, and survival. This comprehensive guide will dissect the lab, providing context, explaining procedures, and offering insights into analyzing the results. We'll also explore common misconceptions and delve deeper into the underlying science.
Understanding Osmosis and Water Potential
Before jumping into the lab procedures, let's solidify our understanding of the core concepts.
Osmosis: The Movement of Water
Osmosis is the passive movement of water across a selectively permeable membrane from a region of higher water potential (lower solute concentration) to a region of lower water potential (higher solute concentration). This movement continues until equilibrium is reached, or the water potential is equal on both sides of the membrane.
Water Potential: The Driving Force
Water potential (Ψ) is the measure of the relative tendency of water to move from one area to another. It's expressed in units of pressure (typically megapascals, MPa). Water potential is influenced by two major components:
-
Solute potential (Ψs): This reflects the effect of dissolved solutes on water potential. The presence of solutes lowers the water potential; a higher solute concentration results in a more negative solute potential. Pure water has a solute potential of 0 MPa.
-
Pressure potential (Ψp): This represents the physical pressure on the water. In plant cells, turgor pressure (the pressure exerted by the cell contents against the cell wall) contributes positively to the pressure potential. A flaccid cell has a pressure potential of 0 MPa.
The total water potential is the sum of the solute and pressure potentials: Ψ = Ψs + Ψp
The AP Biology Osmosis and Water Potential Lab: A Step-by-Step Approach
The specific procedures may vary slightly depending on your teacher's instructions, but the fundamental principles remain the same. The lab typically involves using various solutions with different sucrose concentrations and observing their effects on plant tissue, often potato cores or dialysis tubing bags filled with sucrose solutions.
Materials: What You'll Need
- Potatoes (or other suitable plant tissue)
- Corer or knife for creating uniform potato cores
- Sucrose solutions of varying concentrations (e.g., 0.0M, 0.2M, 0.4M, 0.6M, 0.8M, 1.0M)
- Beakers or containers to hold the solutions
- Graduated cylinders for measuring solution volume
- Balance for weighing potato cores
- Ruler for measuring potato core length
- Paper towels for blotting
- Graph paper or data analysis software
Procedure: A Detailed Outline
-
Prepare potato cores: Use a corer or knife to create uniformly sized potato cores. Ensure they are all approximately the same length and diameter to minimize variability.
-
Weigh the initial mass: Carefully weigh each potato core and record the initial mass in a data table.
-
Submerge in solutions: Place groups of potato cores into separate beakers containing different sucrose solutions. Each beaker should contain a solution of a specific molarity (concentration). Make sure the potato cores are fully submerged.
-
Incubation period: Allow the potato cores to soak in the solutions for a predetermined period (e.g., 24-48 hours). This allows sufficient time for osmosis to occur.
-
Remove and blot: After the incubation period, remove the potato cores from the solutions. Gently blot them dry with a paper towel to remove excess surface water. Avoid squeezing the cores, which could alter their water content.
-
Weigh the final mass: Carefully weigh each potato core again and record its final mass in your data table.
-
Calculate percent change in mass: For each potato core, calculate the percent change in mass using the following formula:
(Final Mass - Initial Mass) / Initial Mass * 100% -
Determine the isotonic point: Analyze your data. The point at which there is no change in mass (0% change) indicates the isotonic point – the sucrose concentration that has the same water potential as the potato cells. In this state, there's no net movement of water into or out of the cells.
Analyzing the Results and Interpreting the Data
The data obtained from the experiment will show a correlation between the sucrose concentration and the percent change in mass of the potato cores. Plotting the data on a graph, with sucrose concentration on the x-axis and percent change in mass on the y-axis, will visualize this relationship.
Understanding the Graph
The graph will likely show a linear relationship:
-
Hypertonic solutions: In solutions with higher sucrose concentrations (and therefore more negative water potentials), the potato cores will lose water (negative percent change in mass) due to osmosis. Water moves from the potato cells (higher water potential) to the surrounding solution (lower water potential). This results in plasmolysis (cell shrinkage).
-
Hypotonic solutions: In solutions with lower sucrose concentrations (less negative water potentials), the potato cores will gain water (positive percent change in mass) as water moves into the cells from the solution. This results in turgor pressure and cell expansion.
-
Isotonic point: The point where the line crosses the x-axis (0% change in mass) represents the isotonic point. At this concentration, the water potential of the potato cells is equal to the water potential of the solution, resulting in no net water movement.
Calculating Water Potential
You can use the isotonic point determined from the experiment to estimate the water potential of the potato cells. This involves using the following equation, which is a simplified version of the water potential equation and assumes that the pressure potential is negligible in the isotonic point:
Ψpotato ≈ Ψsolution (at isotonic point)
Ψsolution = Ψs (at isotonic point) which can be estimated using the solute potential equation
This estimation is approximate because it ignores other factors that may influence the water potential of the potato cells, such as the presence of other solutes besides sucrose and the effect of slight pressure potential differences. More sophisticated methods are needed for more precise calculations.
Common Misconceptions and Troubleshooting
-
Inaccurate measurements: Ensure you use precise measuring instruments and techniques to minimize errors in weighing and measuring the potato cores and solutions.
-
Uneven potato cores: Using uniform potato cores is crucial. Variability in size and shape will lead to inconsistent results.
-
Insufficient incubation time: Allow sufficient time for osmosis to reach equilibrium. Too short an incubation period may not allow for complete water movement.
-
Contamination: Keep the solutions and materials clean to prevent contamination, which can affect the results.
-
Temperature fluctuations: Temperature changes can influence osmosis. Maintain a relatively constant temperature throughout the experiment.
Expanding on the Experiment: Advanced Concepts
The basic AP Biology osmosis and water potential lab can be expanded upon to explore more advanced concepts:
-
Different plant tissues: Compare the osmotic behavior of different plant tissues (e.g., leaves, stems) to observe variations in water potential.
-
Effect of temperature: Investigate the impact of temperature on the rate of osmosis.
-
Other solutes: Experiment with solutions containing solutes other than sucrose to investigate how different solutes affect water potential.
-
Modeling using dialysis tubing: Use dialysis tubing bags filled with different sucrose solutions to visualize the movement of water across a semi-permeable membrane. This is a great technique to observe how osmotic pressure affects volume change.
Conclusion: Mastering Osmosis and Water Potential
The AP Biology osmosis and water potential lab is a powerful tool for understanding fundamental concepts in plant physiology. By carefully conducting the experiment, accurately analyzing the data, and critically evaluating the results, you will gain a solid grasp of osmosis, water potential, and their crucial role in plant survival and growth. Remember, the key to success lies in meticulous attention to detail, accurate data collection, and a thorough understanding of the underlying scientific principles. By mastering these aspects, you'll be well-prepared for the challenges of AP Biology and beyond.
Latest Posts
Latest Posts
-
Who Is The Author Of Exploit Db
Apr 01, 2025
-
Offset Lithography Is A Form Of Intaglio Printing
Apr 01, 2025
-
Alex Wanted To Find Out What Toothpaste
Apr 01, 2025
-
Do You Have 5 Seconds Answer Key
Apr 01, 2025
-
Nr 509 Final Exam 88 Questions Pdf
Apr 01, 2025
Related Post
Thank you for visiting our website which covers about Ap Biology Lab Osmosis And Water Potential Answer Key . We hope the information provided has been useful to you. Feel free to contact us if you have any questions or need further assistance. See you next time and don't miss to bookmark.
