Creating Ld50 Graphs For Different Substances
Onlines
Mar 25, 2025 · 6 min read
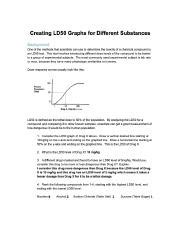
Table of Contents
Creating LD50 Graphs for Different Substances: A Comprehensive Guide
Determining the lethal dose 50 (LD50) of a substance is a crucial step in toxicology, providing a quantitative measure of its acute toxicity. Understanding how to create and interpret LD50 graphs is vital for researchers, regulators, and anyone working with potentially hazardous materials. This comprehensive guide will walk you through the entire process, from experimental design to data visualization and interpretation.
Understanding LD50 and its Significance
The LD50 value represents the dose of a substance that is lethal to 50% of a tested population. It's expressed as a dose per unit of body weight (e.g., mg/kg). A lower LD50 indicates higher toxicity; a smaller amount of the substance is needed to kill half the population. The LD50 is a critical parameter used in:
- Risk assessment: Determining the potential hazards of a substance and setting safety guidelines.
- Regulatory purposes: Informing the classification and labeling of chemicals.
- Comparative toxicology: Comparing the toxicity of different substances.
- Drug development: Assessing the safety profile of new drugs and compounds.
The Process of Determining LD50
Accurately determining the LD50 requires rigorous experimental design and careful data analysis. Here's a breakdown of the key steps involved:
1. Experimental Design: Choosing the Right Model
- Species Selection: The choice of animal model is crucial. Commonly used species include mice, rats, and rabbits, selected based on factors like availability, cost, and relevance to human exposure. Ethical considerations are paramount, and the choice should minimize animal suffering. The selection must be justified based on the specific substance being tested and the intended application of the LD50 data.
- Dose Selection: A range of doses must be chosen, encompassing the expected lethal range. This often involves pilot studies to get a preliminary estimate. Doses are usually expressed logarithmically to improve data visualization.
- Route of Administration: The method of administering the substance (oral, intravenous, dermal, etc.) needs to be carefully selected as it significantly impacts toxicity. This must be clearly defined and consistent throughout the experiment.
- Number of Animals: A sufficient number of animals per dose group is essential for statistical power and accuracy. The number depends on factors such as the expected variability in response and the desired level of precision.
- Control Group: A control group receiving a vehicle (e.g., saline) is necessary to establish baseline mortality and account for factors unrelated to the test substance.
2. Data Collection and Measurement
Once the substance is administered, animals are monitored closely for signs of toxicity and mortality. Accurate record-keeping is vital, including:
- Time of death: Precise recording of the time each animal succumbs is crucial for calculating the LD50.
- Clinical signs: Observations of any behavioral changes, physiological symptoms, or other indications of toxicity should be documented. This allows a more complete picture of the substance's effects.
- Necropsies (Optional): In some cases, post-mortem examinations may be performed to investigate the cause of death and understand the mechanism of toxicity.
3. Data Analysis: Calculating the LD50
Several statistical methods can be used to estimate the LD50 from the collected mortality data. The most common approach involves probit analysis or log-probit analysis. These methods use statistical models to fit a curve to the data, providing a more precise estimation of the LD50 than simply calculating the median lethal dose from raw data. Specialized statistical software packages are often employed for these calculations, which often involve iteration and complex algorithms. These methods allow for the calculation of confidence intervals, providing a measure of uncertainty around the LD50 estimate.
4. Graphing the Results
The LD50 and its confidence interval are typically presented graphically using a dose-response curve. This curve plots the percentage of mortality against the logarithm of the dose. The LD50 is the dose corresponding to 50% mortality on the curve. The graph should include:
- X-axis: Logarithm of the dose (e.g., log10 mg/kg). Using a logarithmic scale allows for better visualization of a wide range of doses and enhances the curve's clarity.
- Y-axis: Percentage mortality. Clearly labeled axes are crucial for interpretation.
- Data points: Individual data points for each dose group, illustrating the observed mortality.
- Fitted curve: The best-fit curve (often a sigmoid curve) generated using probit or log-probit analysis.
- LD50 value: The estimated LD50 value clearly indicated on the graph.
- Confidence intervals: The 95% confidence interval around the LD50, representing the uncertainty in the estimation.
- Clear labels and legend: All axes, data points, and other elements should be clearly labeled, including the substance tested, species used, and route of administration.
Interpreting LD50 Graphs
The LD50 graph provides a visual representation of the relationship between dose and mortality. A steep slope indicates that a small change in dose results in a large change in mortality, suggesting a relatively predictable response. A shallower slope indicates greater variability in the response to the substance. Comparing LD50 values for different substances allows for a relative assessment of toxicity, but it's essential to remember that the LD50 is just one aspect of toxicity and doesn't fully capture the overall toxicological profile.
Ethical Considerations
The use of animals in LD50 studies raises significant ethical concerns. The 3Rs (Replacement, Reduction, Refinement) principles should always be applied to minimize animal suffering and the number of animals used. Replacement involves using alternative methods when possible, reduction aims to use the smallest number of animals necessary, and refinement focuses on minimizing pain and distress.
Limitations of LD50
It is crucial to acknowledge the limitations of LD50 values:
- Species Specificity: LD50 values are species-specific and may not accurately reflect human toxicity.
- Acute Toxicity Only: LD50 assesses only acute toxicity (short-term effects), ignoring chronic effects from long-term exposure.
- Simplification of Complex Processes: It simplifies the complex biological interactions influencing toxicity.
- Variability in Results: Experimental results can vary due to factors like animal strain, environmental conditions, and assay methods.
Alternatives to LD50
Due to ethical and scientific limitations, alternative methods are increasingly being sought:
- In vitro assays: Cell-based assays can provide information on toxicity without using animals.
- Quantitative Structure-Activity Relationships (QSAR): These models predict toxicity based on the chemical structure of the substance.
- High-throughput screening: This technique allows for rapid assessment of many substances.
Conclusion
Creating LD50 graphs involves a multifaceted process encompassing careful experimental design, rigorous data analysis, and ethical considerations. While LD50 remains a valuable tool for assessing acute toxicity, it's crucial to interpret the data cautiously and consider its limitations. The increasing adoption of alternative methods underscores a shift towards more humane and scientifically robust approaches to toxicity assessment. Accurate and transparent reporting, including acknowledging limitations and uncertainties, is paramount for responsible scientific practice. Understanding the creation and interpretation of LD50 graphs is essential for anyone working in toxicology, environmental science, or any field dealing with potentially hazardous substances.
Latest Posts
Latest Posts
-
Ap Chem Unit 4 Progress Check Mcq
Mar 28, 2025
-
A Sedentary Job Is One That Requires Physical Exertion
Mar 28, 2025
-
After Selecting System Presets And Pressing Enter
Mar 28, 2025
-
Differentiation Of The Curriculum Falls Into What Three Main Categories
Mar 28, 2025
-
Agent Jennings Makes A Presentation On Medicare
Mar 28, 2025
Related Post
Thank you for visiting our website which covers about Creating Ld50 Graphs For Different Substances . We hope the information provided has been useful to you. Feel free to contact us if you have any questions or need further assistance. See you next time and don't miss to bookmark.
