Excel Aided Optimization Of A Circuitous Path Through Points
Onlines
Mar 17, 2025 · 6 min read
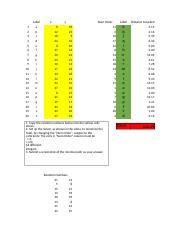
Table of Contents
Excel-Aided Optimization of a Circuitous Path Through Points
Finding the optimal path through a series of points is a common problem across various fields, from logistics and transportation to robotics and network design. While complex algorithms exist to solve this, Microsoft Excel, with its powerful features and accessibility, provides a surprisingly effective tool for optimizing circuitous paths, especially for smaller datasets. This article explores how to leverage Excel's capabilities to find the shortest or most efficient route, considering factors like distance, time, or cost.
Understanding the Problem: The Traveling Salesperson Problem (TSP)
The core challenge we're addressing is a variation of the Traveling Salesperson Problem (TSP). The classic TSP aims to find the shortest possible route that visits each city (point) exactly once and returns to the origin city. However, our focus expands beyond mere shortest distance to encompass scenarios where other factors influence the optimal path. We might need to minimize total travel time, which could involve considering traffic conditions or varying speeds. Or we may seek to minimize costs, factoring in fuel consumption or tolls.
Data Preparation in Excel: Laying the Foundation
Before delving into optimization, meticulous data preparation is crucial. Assume we have a set of points, each with its coordinates (X and Y). We can represent this data in Excel as follows:
| Point | X-Coordinate | Y-Coordinate |
|---|---|---|
| A | 10 | 20 |
| B | 30 | 15 |
| C | 25 | 40 |
| D | 50 | 30 |
| E | 40 | 5 |
This table forms the basis of our optimization efforts. Next, we need to calculate the distances between each pair of points. This is where Excel's formula capabilities shine.
Calculating Distances: The Pythagorean Theorem
The most straightforward approach to calculating distances between points is using the Pythagorean theorem. For two points (x1, y1) and (x2, y2), the distance 'd' is calculated as:
d = √((x2 - x1)² + (y2 - y1)²)
In Excel, we can implement this formula to create a distance matrix. Let's assume our point data starts in cell A2. In cell F2, we'd enter the following formula (and then drag it across and down to create the matrix):
=SQRT((B2-$B$2)^2+(C2-$C$2)^2)
This formula calculates the distance between Point A and Point A (which will be 0). When you copy this formula across and down, it automatically adjusts the cell references, computing distances between all pairs of points. The resulting distance matrix will appear as follows (values rounded for brevity):
| A | B | C | D | E | |
|---|---|---|---|---|---|
| A | 0 | 22.36 | 22.36 | 44.72 | 35.36 |
| B | 22.36 | 0 | 25 | 28.28 | 30 |
| C | 22.36 | 25 | 0 | 25 | 37.08 |
| D | 44.72 | 28.28 | 25 | 0 | 26.93 |
| E | 35.36 | 30 | 37.08 | 26.93 | 0 |
This matrix is the cornerstone of our optimization process. Each cell represents the distance between two points. Now we can move on to path optimization techniques.
Optimization Techniques: Brute Force and Heuristics
Several approaches exist for finding the optimal path. For a small number of points, brute force—trying every possible permutation—is feasible. However, as the number of points increases, the computational time grows exponentially. This makes brute force impractical for larger datasets.
For larger problems, heuristic algorithms offer a more practical solution. These algorithms don't guarantee finding the absolute best solution but provide good approximations within reasonable time. One popular heuristic is the Nearest Neighbor algorithm.
Nearest Neighbor Algorithm in Excel
The Nearest Neighbor algorithm starts at a random point and iteratively moves to the nearest unvisited point until all points are visited. While not guaranteeing the shortest path, it's computationally efficient. Manual implementation in Excel is possible but cumbersome. However, we can achieve this using Solver, Excel's built-in optimization tool.
First, we need to create a column to represent the path sequence. For example, we can use column G to denote the order in which the points are visited:
| Point | X-Coordinate | Y-Coordinate | Path Sequence |
|---|---|---|---|
| A | 10 | 20 | 1 |
| B | 30 | 15 | 2 |
| C | 25 | 40 | 3 |
| D | 50 | 30 | 4 |
| E | 40 | 5 | 5 |
We will use Solver to rearrange the numbers in the Path Sequence column, finding the permutation with the minimal total distance.
To calculate the total distance, we need to use the INDEX and MATCH functions to lookup the distance from the distance matrix based on the sequence in the "Path Sequence" column. A formula for calculating the distance between consecutive points in the path would then need to be written.
Next, we can use Solver:
- Set Objective: Set the cell containing the total distance as the objective to minimize.
- Changing Variable Cells: Select the cells in the "Path Sequence" column as the changing variables.
- Constraints: Add constraints to ensure that each number appears only once in the path sequence. This may require using binary variables or creating helper columns.
- Solving Method: Choose a suitable solving method. Evolutionary solvers are usually effective for TSP-type problems.
Solver will then iterate through different path permutations, finding one that minimizes the total distance, giving you a near-optimal solution.
Incorporating Time or Cost Factors
The power of Excel lies in its flexibility. We can easily extend this approach to incorporate time or cost considerations. Simply replace the distance matrix with a matrix reflecting travel time or cost. This might involve adding columns for travel speed or cost per unit distance to our initial dataset. Then, repeat the optimization process using Solver.
Advanced Techniques and Considerations
-
Genetic Algorithms: For larger datasets, more sophisticated algorithms like genetic algorithms can find near-optimal solutions more efficiently than Solver's built-in methods. While implementing genetic algorithms directly in Excel is challenging, there are VBA scripts or add-ins available to facilitate this.
-
Dynamic Programming: Dynamic programming provides an exact solution for the TSP but can be computationally expensive for larger problems. However, it's a possible area of exploration if computational power is not a constraint.
-
Approximation Algorithms: For large-scale problems, approximation algorithms offer a compromise between solution quality and computational cost. Christofides algorithm is a prime example of this.
Conclusion: Excel's Unsung Power in Optimization
While specialized software packages exist for solving the TSP and similar optimization problems, Excel provides a powerful and accessible platform for tackling these challenges, especially for smaller datasets. By carefully preparing your data, understanding the underlying algorithms, and leveraging Excel's built-in features like Solver, you can efficiently find near-optimal circuitous paths, considering various factors like distance, time, and cost. Remember that the choice of algorithm and the complexity of your problem will dictate the effectiveness of your Excel-based optimization strategy. Always consider the trade-off between solution quality and computational time. The methods presented here give a solid starting point, paving the way for further exploration into advanced optimization techniques as needed.
Latest Posts
Latest Posts
-
Experiment 1 The Densities Of Liquids And Solids
Mar 17, 2025
-
Which Cognitive Attribute Will Positively Impact Your Student Experience
Mar 17, 2025
-
The Gold And Salt Trade Answer Key
Mar 17, 2025
-
Tuesdays With Morrie Summary Every Chapter
Mar 17, 2025
-
Vulvar Cancer In Situ Can Also Be Documented As
Mar 17, 2025
Related Post
Thank you for visiting our website which covers about Excel Aided Optimization Of A Circuitous Path Through Points . We hope the information provided has been useful to you. Feel free to contact us if you have any questions or need further assistance. See you next time and don't miss to bookmark.
