Unit 2 Functions And Their Graphs
Onlines
Mar 03, 2025 · 6 min read
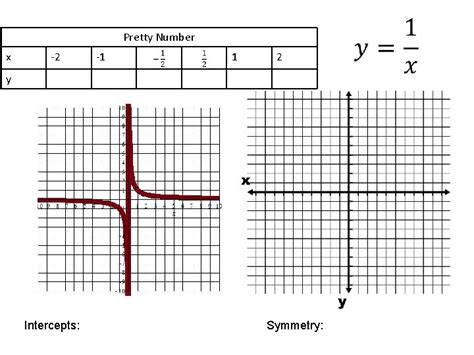
Table of Contents
Unit 2: Functions and Their Graphs – A Comprehensive Guide
This comprehensive guide delves into the fascinating world of functions and their graphs, a cornerstone of algebra and precalculus. We'll explore key concepts, techniques, and applications to solidify your understanding and build a strong foundation for advanced mathematical studies.
What is a Function?
At its core, a function is a relationship between two sets of values, typically denoted as x (input) and y (output). For every input value (x), there is exactly one corresponding output value (y). This "one-to-one" or "many-to-one" relationship is crucial. We represent this relationship using function notation: f(x) (read as "f of x"), where f(x) represents the output value associated with the input x.
Think of a function like a machine: you input a value (x), the machine processes it according to a specific rule, and outputs a single, corresponding value (f(x)).
Key Characteristics of Functions:
- Domain: The set of all possible input values (x) for which the function is defined.
- Range: The set of all possible output values (y) produced by the function.
- Vertical Line Test: A graphical method to determine if a relation is a function. If any vertical line intersects the graph more than once, it's not a function.
Types of Functions
Mathematics boasts a diverse array of functions, each with unique properties and applications. Let's examine some common types:
1. Linear Functions:
Linear functions are characterized by their constant rate of change. They have the form:
f(x) = mx + b
where:
- m is the slope (representing the rate of change), and
- b is the y-intercept (the point where the graph intersects the y-axis).
Linear functions produce straight lines when graphed. The slope determines the steepness and direction of the line (positive slope: upward, negative slope: downward). The y-intercept indicates where the line crosses the y-axis.
2. Quadratic Functions:
Quadratic functions have the general form:
f(x) = ax² + bx + c
where a, b, and c are constants, and a ≠ 0. These functions produce parabolas when graphed – U-shaped curves. The value of a determines the parabola's orientation (positive a: opens upwards, negative a: opens downwards). The vertex represents the minimum or maximum point of the parabola.
Finding the vertex is crucial for understanding a quadratic function's behavior. The x-coordinate of the vertex is given by: x = -b / 2a. Substituting this value back into the function gives the y-coordinate of the vertex.
3. Polynomial Functions:
Polynomial functions are a broader category encompassing linear and quadratic functions. They are defined by:
f(x) = aₙxⁿ + aₙ₋₁xⁿ⁻¹ + ... + a₁x + a₀
where aₙ, aₙ₋₁, ..., a₁, a₀ are constants, and n is a non-negative integer (the degree of the polynomial). The degree determines the maximum number of x-intercepts (points where the graph crosses the x-axis) and turning points (where the graph changes direction).
Higher-degree polynomials exhibit more complex curves. Analyzing their behavior requires understanding their roots (x-intercepts), turning points, and end behavior (what happens to the function values as x approaches positive and negative infinity).
4. Rational Functions:
Rational functions are expressed as the ratio of two polynomial functions:
f(x) = P(x) / Q(x)
where P(x) and Q(x) are polynomials, and Q(x) ≠ 0. These functions often have asymptotes – lines that the graph approaches but never touches. Vertical asymptotes occur where the denominator is zero, and horizontal asymptotes describe the function's behavior as x approaches infinity.
Analyzing rational functions involves identifying asymptotes, intercepts, and the function's behavior in different intervals.
5. Exponential Functions:
Exponential functions have the form:
f(x) = aˣ
where a is a positive constant (base) and a ≠ 1. The variable x is in the exponent. These functions exhibit exponential growth (if a > 1) or decay (if 0 < a < 1). They are commonly used to model phenomena such as population growth, radioactive decay, and compound interest.
6. Logarithmic Functions:
Logarithmic functions are the inverse of exponential functions. They have the form:
f(x) = logₐ(x)
where a is the base (a positive constant, a ≠ 1). The logarithm base a of x is the exponent to which a must be raised to obtain x. Logarithmic functions are essential in various applications, including measuring sound intensity (decibels) and solving exponential equations.
7. Trigonometric Functions:
Trigonometric functions (sine, cosine, tangent, etc.) describe the relationships between angles and sides of a right-angled triangle. They are periodic functions, meaning their graphs repeat in a regular pattern. Understanding their properties, graphs, and identities is crucial in calculus, physics, and engineering.
Graphing Functions
Graphing functions visually represents their behavior. Accurate graphing requires understanding the function's type, key features (intercepts, asymptotes, vertex, etc.), and domain and range. Utilizing technology like graphing calculators or software is often beneficial for complex functions.
Techniques for Graphing:
- Plotting points: Creating a table of x and y values and plotting them on the coordinate plane. This is particularly useful for simpler functions.
- Transformations: Understanding how changes to the function's equation (e.g., adding a constant, multiplying by a constant) affect its graph. Translations, reflections, and stretches/compressions can be visually interpreted.
- Using key features: Identifying intercepts, asymptotes, vertex, and other key points simplifies sketching the graph.
- Analyzing end behavior: Determining what happens to the function's values as x approaches positive and negative infinity.
Applications of Functions
Functions are ubiquitous in various fields. Here are some examples:
- Physics: Modeling projectile motion, analyzing wave phenomena, describing oscillations.
- Engineering: Designing structures, analyzing circuits, simulating systems.
- Economics: Modeling supply and demand, predicting market trends, analyzing economic growth.
- Computer Science: Developing algorithms, creating simulations, managing data.
- Biology: Modeling population growth, studying disease spread, analyzing genetic information.
Solving Problems Involving Functions
Problem-solving with functions involves understanding the given information, identifying the relevant function type, and applying appropriate techniques. This may include:
- Finding the domain and range: Determining the set of possible input and output values.
- Evaluating function values: Calculating the output for a given input.
- Finding intercepts: Determining where the graph crosses the x and y axes.
- Solving equations involving functions: Finding the input values that produce a specific output.
- Analyzing graphs: Interpreting the visual representation of the function to extract information.
Advanced Concepts
Further exploration of functions delves into topics such as:
- Function composition: Combining two or more functions to create a new function.
- Inverse functions: Finding the inverse of a function, which reverses the input-output relationship.
- Piecewise functions: Defining a function differently across different intervals of its domain.
- Limits and continuity: Exploring the behavior of functions near specific points. These are foundational concepts for calculus.
Conclusion
Understanding functions and their graphs is paramount for success in mathematics and its applications. Mastering the concepts, techniques, and various function types will empower you to solve complex problems, model real-world phenomena, and build a robust foundation for advanced mathematical studies. Consistent practice, exploration of diverse problem types, and utilization of graphical tools will significantly enhance your understanding and proficiency in this crucial area of mathematics. Remember to always focus on building a conceptual understanding, not just memorizing formulas and procedures. This approach fosters deeper learning and enhances your ability to apply your knowledge in various contexts.
Latest Posts
Latest Posts
-
Whats In Your Water Case Study Answers
Mar 03, 2025
-
Manager Must Not Interpert Variances In Isolation From Each Other
Mar 03, 2025
-
Mth1112 Pre Calc With Algebra Formula Sheet Troy
Mar 03, 2025
-
Financial Goal Worksheet Sudent Handout 2b
Mar 03, 2025
-
In Habitats With Limited Nutrients Sat
Mar 03, 2025
Related Post
Thank you for visiting our website which covers about Unit 2 Functions And Their Graphs . We hope the information provided has been useful to you. Feel free to contact us if you have any questions or need further assistance. See you next time and don't miss to bookmark.
