Elementary Statistics Final Exam Cheat Sheet
Onlines
Mar 27, 2025 · 6 min read
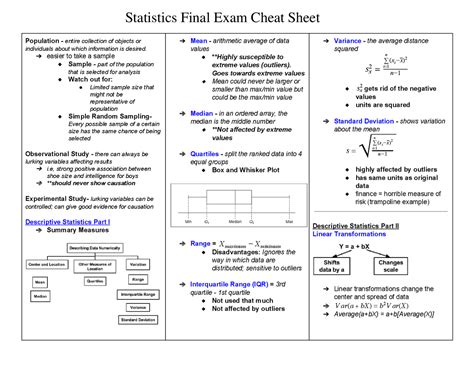
Table of Contents
Elementary Statistics Final Exam Cheat Sheet: A Comprehensive Guide
Facing your elementary statistics final exam can be daunting. This comprehensive cheat sheet aims to provide a concise yet thorough review of key concepts, formulas, and techniques to help you ace your exam. Remember, this cheat sheet is a tool for review, not a replacement for understanding the underlying concepts. Consistent practice and a solid grasp of the material are essential for success.
I. Descriptive Statistics: Summarizing Data
Descriptive statistics help us understand and summarize data. We use both numerical and graphical methods.
A. Measures of Central Tendency
These describe the "middle" or typical value of a dataset.
- Mean (average): Sum of all values divided by the number of values. Sensitive to outliers. Formula: ∑x / n
- Median: The middle value when data is ordered. Less sensitive to outliers than the mean. For even number of data points, it's the average of the two middle values.
- Mode: The most frequent value. A dataset can have multiple modes or no mode at all.
When to use which:
- Mean: Best for symmetrical distributions without outliers.
- Median: Best for skewed distributions or those with outliers.
- Mode: Useful for categorical data or identifying the most common value.
B. Measures of Dispersion (Variability)
These describe the spread or variability of data.
- Range: The difference between the maximum and minimum values. Simple but sensitive to outliers.
- Variance: The average of the squared deviations from the mean. Formula: ∑(x - μ)² / (n-1) (sample variance; use 'n' for population variance).
- Standard Deviation: The square root of the variance. Expressed in the same units as the data. A measure of how spread out the data is from the mean.
- Interquartile Range (IQR): The difference between the third quartile (Q3) and the first quartile (Q1). Less sensitive to outliers than the range. IQR = Q3 - Q1
C. Graphical Representations
Visualizing data helps to identify patterns and trends.
- Histograms: Show the frequency distribution of a continuous variable.
- Box Plots (Box and Whisker Plots): Display the median, quartiles, and potential outliers. Excellent for comparing distributions.
- Stem-and-Leaf Plots: A simple way to display the shape of a distribution.
- Scatter Plots: Show the relationship between two variables.
II. Probability
Probability measures the likelihood of an event occurring.
A. Basic Probability Concepts
- Experiment: A process that leads to an outcome.
- Sample Space: The set of all possible outcomes.
- Event: A subset of the sample space.
- Probability of an Event: The ratio of favorable outcomes to the total number of possible outcomes. P(A) = number of favorable outcomes / total number of outcomes.
B. Types of Probability
- Classical Probability: Based on equally likely outcomes.
- Empirical Probability: Based on observed frequencies.
- Subjective Probability: Based on personal judgment or belief.
C. Probability Rules
- Addition Rule: P(A or B) = P(A) + P(B) - P(A and B) (for non-mutually exclusive events). P(A or B) = P(A) + P(B) (for mutually exclusive events).
- Multiplication Rule: P(A and B) = P(A) * P(B) (for independent events). P(A and B) = P(A) * P(B|A) (for dependent events).
- Conditional Probability: P(A|B) = P(A and B) / P(B) (probability of A given B).
- Complement Rule: P(A') = 1 - P(A) (probability of A not occurring).
D. Discrete Probability Distributions
- Binomial Distribution: Models the probability of k successes in n independent trials, each with probability of success p. Formula: P(X=k) = (nCk) * p^k * (1-p)^(n-k), where nCk is the binomial coefficient.
- Poisson Distribution: Models the probability of a certain number of events occurring in a fixed interval of time or space. Formula: P(X=k) = (λ^k * e^-λ) / k!, where λ is the average number of events.
III. Inferential Statistics: Making Inferences about Populations
Inferential statistics allows us to make inferences about a population based on a sample.
A. Sampling Distributions
- Sampling Distribution of the Mean: The distribution of sample means from all possible samples of a given size. Approaches a normal distribution as sample size increases (Central Limit Theorem).
- Standard Error of the Mean: The standard deviation of the sampling distribution of the mean. Formula: σ/√n (for known population standard deviation) or s/√n (for unknown population standard deviation).
B. Confidence Intervals
- Confidence Interval for the Mean: A range of values within which we are confident that the true population mean lies. Formula: x̄ ± z*(σ/√n) or x̄ ± t*(s/√n) (where z is the z-score for the desired confidence level and t is the t-score).
C. Hypothesis Testing
- Null Hypothesis (H0): A statement of no effect or no difference.
- Alternative Hypothesis (H1 or Ha): A statement that contradicts the null hypothesis.
- Test Statistic: A value calculated from the sample data used to test the null hypothesis.
- p-value: The probability of observing the sample data (or more extreme data) if the null hypothesis is true. A small p-value (typically less than 0.05) provides evidence against the null hypothesis.
- Significance Level (α): The probability of rejecting the null hypothesis when it is actually true (Type I error).
D. Types of Hypothesis Tests
- One-sample t-test: Tests whether the mean of a single population is different from a specified value.
- Two-sample t-test: Tests whether the means of two independent populations are different.
- Paired t-test: Tests whether the means of two related populations are different.
- Chi-square test: Tests whether there is a significant association between two categorical variables.
- Z-test: Used when the population standard deviation is known and the sample size is large.
E. Interpreting Results
Understanding p-values and making conclusions based on the results of hypothesis tests is critical. Remember to consider the context of the problem and the limitations of your data.
IV. Regression Analysis
Regression analysis examines the relationship between a dependent variable and one or more independent variables.
A. Simple Linear Regression
Models the relationship between one dependent and one independent variable using a straight line. Equation: Y = β0 + β1X + ε, where β0 is the y-intercept, β1 is the slope, and ε is the error term.
B. Multiple Linear Regression
Models the relationship between a dependent variable and two or more independent variables.
C. Correlation
Measures the strength and direction of the linear relationship between two variables. Correlation coefficient (r) ranges from -1 (perfect negative correlation) to +1 (perfect positive correlation). 0 indicates no linear correlation.
V. Important Considerations
- Assumptions of Statistical Tests: Many statistical tests rely on certain assumptions about the data (e.g., normality, independence). Violating these assumptions can affect the validity of the results.
- Outliers: Outliers can significantly influence the results of statistical analyses. Consider methods for handling outliers, such as transformations or robust statistical methods.
- Sample Size: The sample size affects the power and precision of statistical analyses. Larger samples generally lead to more reliable results.
This cheat sheet provides a broad overview of key concepts in elementary statistics. Remember to consult your textbook, notes, and practice problems to solidify your understanding. Good luck with your final exam!
Latest Posts
Latest Posts
-
Identifying Transformations Worksheet Homework 5 Answer Key
Mar 30, 2025
-
Bark Or Rind Is The Meaning Of The Prefix
Mar 30, 2025
-
Financial Decisions And Opportunity Cost Answer Key
Mar 30, 2025
-
Pn Learning System Medical Surgical Endocrine Practice Quiz
Mar 30, 2025
-
Which Sentence Is The Clearest Example Of Deductive Reasoning
Mar 30, 2025
Related Post
Thank you for visiting our website which covers about Elementary Statistics Final Exam Cheat Sheet . We hope the information provided has been useful to you. Feel free to contact us if you have any questions or need further assistance. See you next time and don't miss to bookmark.
